
Testing The RF Shielding Efficiency Of A Bed Canopy
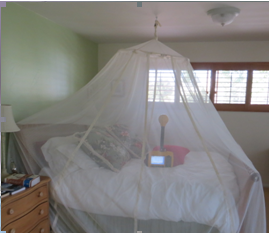
RF shielding Bed Canopy
With the ever increasing exposure to wireless sources, emissions and associated health concerns, a large number of radio frequency (RF) shielding products have entered the consumer market. To shed some light on the actual shielding results after installation, we are conducting a number of surveys under real-life situations. This report addresses the use of an RF shielding fabric (Swiss Shield® Daylight™) as a bed canopy and window curtains in a master bedroom of a residential building.
In this case, a cellular base station with 16 individual directional antennas is located about one block from a residential building. The master bedroom is located on the second floor level. Windows and a sliding door are located in the direction of the cellular base station. The purpose of the study is to identify the RF shielding efficiency (attenuation) of the bed canopy and window curtains under real-life conditions. The distributor rates the material with 16dB-20dB attenuation.
The efficiency of RF shielding materials (i.e. the field before and the reduction afterwards) is expressed as dB (decibel) or reduction in percentage (%) and is displayed in the table below.
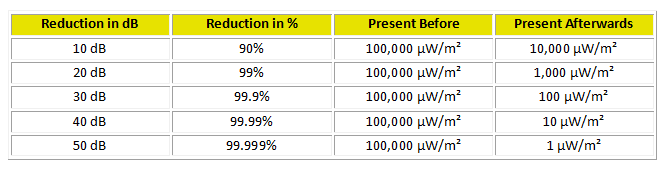 The degree of the field reduction is also dependent of the frequencies present. The attenuation data (field reduction levels) provided by some manufacturers is questionable for real-life conditions. For example, one company rates their aluminum foil backed plywood sheeting with an attenuation of 100dB. This would constitute a reduction from 10,000,000,000 to 1. This is unrealistic to achieve with such material in real life.
RF Instrumentation and Methodology
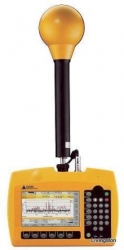
Narda SRM 3006
A Narda Selective Radiation Meter SRM-3006 with an isotropic antenna is used in our surveys. We ascertain the frequency spectrum and assess the power density or field strength levels.The Narda SRM-3006 is professional, calibrated instrument designed for measurements of high frequency RF and microwave radiation, identifying external and internal RF sources, their signal type and amplitude. The instrument has a measurements range from 26 MHz to 6,000 MHz. Our focus was emissions in the 700, 850, 1900 and 2100 MHz cellular frequency bands.
A spectrum analysis was performed to identify the individual RF emission sources. Once the frequency bands are identified, measurements were conducted without the fabric present to obtain baseline exposure levels. The bed canopy was installed and the instrument was place on the bed, under the canopy. Additional measurements were also performed in front of the glass sliding door with and without the RF shielding curtain present.
The Safety Evaluation mode of the instrument is used for power density measurement. The instrument measures each channel individually in an integration mode. The results are expressed as a sum value to allow easy data interpretation. The maximum peak values were recorded and are reported in microWatts per square meter (µW/m²). The total measurement accuracy of the spectrum analyzer with the connected antenna is plus/minus 3 decibels (dB).
RF Spectrum Analysis Results
The first task was to identify the dominant RF frequencies through a spectrum analysis in the 86MHz to 3,000MHz frequency band. This frequency band is used for all cellular base stations, smart meters, FM radio and television transmitters, wireless devices such as routers, cordless phones and game consoles. Graph 1 depicts the individual RF signals detected and their approximate amplitudes. The X-axis displays the frequency and the Y-axis the power density. Power density is displayed on a logarithmic scale.
Graph 1: Frequency Spectrum Analysis from 86 MHz to 3,000 MHz Identifying the RF Sources
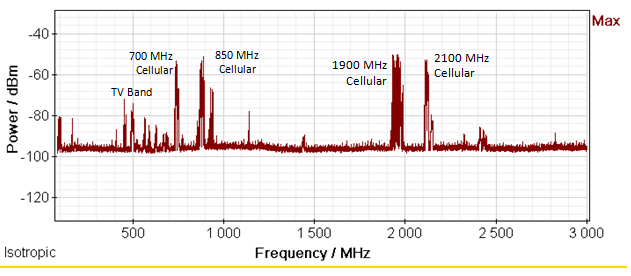
The four (4) cellular bands, in 700 MHz, 850 MHz, 1900 MHz and 2100 MHz, were the most dominant frequencies detected at the master bedroom.
Graph 2: Spectrum Analysis of the 1900 MHz Cellular Band
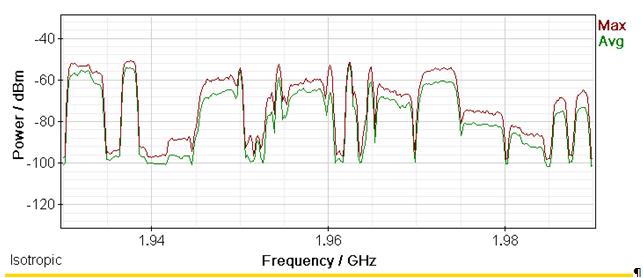
Spectrum Analysis of 1900 MHz Cellular Band
The spectrum analysis shows that the 1900 MHz cellular frequency band is almost fully occupied by cellular base station transmissions.
Measurement Results
Measurements were conducted with the shielding bed canopy fabric off, on and partially on. The same fabric was present at two windows and one glass sliding door in the bedroom. We also measured the exposure level at the bed with and without the window curtains present. Additional measurements were performed directly in front of the glass sliding door with the shielding fabric curtain present and removed.
We selected the CDMA cellular download channels in the 850 MHz and 1900 MHz range as our measurement parameters. The Narda instrument was set to measure the different cellular channels in an integration mode and provide the sum of the power density levels present. The measurement routine was repeated three times for one minute each and the averaged sum results are reported in the results table.
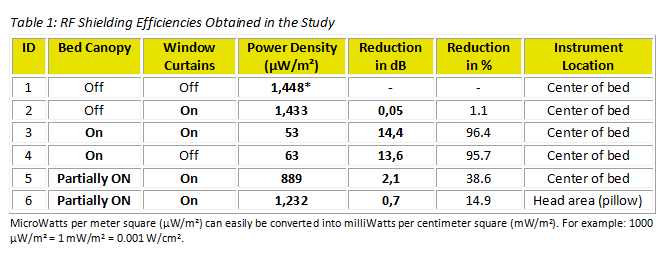
*Baseline for our measurements. This value does not reflect the total power density exposure. The 700 MHz, 2100 MHz, TV and FM radio were not measured in our evaluation. The total exposure is higher than the reported value at this location.
The RF shielding fabric of a bed canopy reduced the RF levels under the canopy significantly. Some people have reported reduced air circulation under the canopy when sleeping in the bed and remove part of the shroud to increase fresh air supply.
Therefore, we partially removed the bed canopy in the head area, termed this setup “Partially ON”. We repeated our 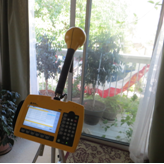 measurement routine with this set -up. Only 2 dB reduction was achieved.
In the second phase of the survey, we conducted additional measurements at the glass sliding door with the shielding fabric curtain. The instrument was placed on a tripod at a distance of 3 feet from the sliding door. The instrument probe is facing the sliding glass door towards the exterior.
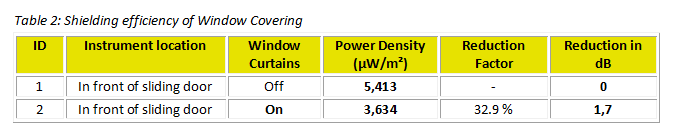
Measurements were performed with the same measurement routine with the curtain in place and with it removed. Again, three sets of measurements were performed and the average values are reported in Table 2.
Conclusion
The RF shielding fabric bed canopy showed a significant reduction, close to the specification. The RF exposures levels underneath the canopy were reduced by 14 dB (96%) in this situation; this is just shy of the 15–20 dB stated by the distributor. However, this requires that the bed is totally enclosed by the canopy fabric.
Lifting or removing the fabric partially will significantly reduce the shielding effect.
The use of window curtains only (without canopy) had very little impact on RF reduction (0.05 dB or 1%) when measured at the bed site itself. The presence or absence of shielding fabric window curtains did not have a significant impact on the reduction when bed canopy is used.
Measurement conducted in front of the glass sliding door with or without a window shielding curtain showed only a reduction of 1.7 dB (33%). One can surmise that the use of shielding fabrics on windows and sliding doors has only a very limited effect on reducing indoor RF levels. More measurements need to be taken to evaluate this finding.
These limited results show that the selection of the measurement location has a significant impact on the obtained results.
We like to continue these studies and are looking for further real-life shielding projects to evaluate other consumer oriented shielding products and rf safety devices. They may involve products such as pain, aluminum foil and wire meshes. If you have a shielding project we can perform measurements of before and after installation, we would like to work with you. Please contact us via email or call 760-942-9400.