RF Radiation Study: How To Measure RF Exposure
In this report you will learn about the process required to analyze, test and evaluate RF emission and RF exposure. A very important tool used to ascertain the type of RF sources and exposures that exist in one indoor environment is the spectrum analyzer. You will learn more about this tool and why it’s so valuable in the report below. In addition, you will be provided with regulatory and precautionary exposure limits for RF. Lets gets started.
Introduction
Our electromagnetic environment has significantly changed over the last decade. New technologies and the wireless world are exposing us to unknown quantities of electromagnetic radiation. Bluetooth, WLAN, wireless, modulated and pulsed signals, time and code division multiplexing are now abundant in our daily lives. High frequency radiation is used for wireless signal transmission and is usually referred to as radio frequency (RF) and microwave radiation.
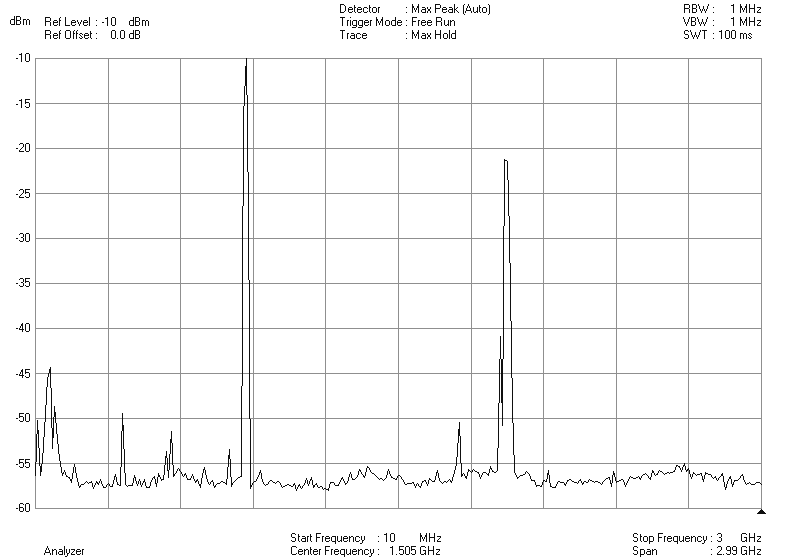
Graph 1: This spectrum analysis graph reflects conditions in a home office in San Diego

Let’s start with the basics and untangle the subject of high frequency fields. We will look at the sources, physics, measurement technologies, reference values and mitigation methods.
The Frequency Spectrum
Radiation is energy that is propagated through space in waves or particles. The most common forms of radiation are x-rays, microwaves, light waves, and radio waves. We differentiate the types of radiation depending on the frequency. Frequency is the rate of polarity change per second and expressed as Hertz (Hz). Our electrical power system in the United States runs on a 60 Hz frequency. Cell phone communication utilizes the 800-900 MegaHz (MHz) or 1.8-1.9 GigaHz (GHz) frequency ranges.
Graph 2: This spectrum analysis represents conditions present in an office with a cell tower in the parking lot
Frequency
Table 1: Common Units Used for High Frequency Radiation
|
Unit |
Symbol/Unit |
Frequency |
Frequency |
|
1000 Hz |
1 kHz (kiloHertz) |
1000 Hz |
103 |
|
1000 kHz |
1 MHz (MegaHertz) |
1000.000 Hz |
106 |
|
1000 MHz |
1 GHz (GigaHertz) |
1000.000.000 Hz |
109 |
|
1000 GHz |
1 THz (TeraHertz) |
1000.000.000.000 Hz |
1012 |
|
1000 THz |
1 PHz (PetaHertz) |
1000.000.000.000.000 Hz |
1015 |
|
1000 PHz |
1 EHz (ExaHertz) |
1000.000.000.000.000.000 Hz |
1018 |
|
1000 EHz |
1 ZHz (ZettaHertz) |
1000.000.000.000.000.000.000 Hz |
1021 |
Diagram 1: Electromagnetic Spectrum

Radio Spectrum and Wave Length
|
ELF |
SLF |
ULF |
VLF |
LF |
MF |
HF |
VHF |
UHF |
SHF |
EHF |
|
3 Hz |
30 Hz |
300Hz |
3kHz |
30kHz |
300kHz |
3MHz |
30MHz |
300MHz |
3GHz |
30GHz |
|
30 Hz |
300Hz |
3kHz |
30kHz |
300kHz |
3MHz |
30MHz |
300MHz |
3GHz |
30GHz |
300Ghz |
| EL | Extremely low | SL | Super low | UL | Ultra low |
| VL | Very Low | L | Low | M | Medium |
| H | High | VH | Very high | UH | Ultra High |
| SH | Super high | EH | Extremely high |
|
10 kHz |
100 kHz |
1 Mhz |
10 MHz |
100 MHz |
1 GHz |
10 GHz |
100 GHz |
|
30 km |
3 km |
300 m |
30 m |
3 m |
30 cm |
3 cm |
3 mm |
Table 2: Frequencies and Associated Usage
| Frequencies | Services |
| 0 Hz | Earth magnetic field, Direct Current, magnets |
| 50-60 Hz | Electrical power in buildings and appliances |
| 400 Hz | Power system in airplanes |
| 3 kHz-30 kHz | Submarine communication |
| 10 – 20 kHz | Door openers, anti-theft devices |
| 535- 1700 kHz | AM Radio |
| 30-50 MHz | Walkie-Talkies, analog cordless phones, amateur radio |
| 88-108 MHz | FM Radio |
| 54-806 MHz | Television |
| 800-940 MHz | Cellular phones, paging, anti-theft, cordless phones |
| 941-944 MHz | Government services |
| 950-1610 MHz | Aviation navigation and transponders, radar, maritime |
| 1240-1300 | Amateur radio |
| 1610 MHz | Satellite phone uplinks |
| 1850-1990 MHz | PCS cellular phones |
| 2483 – 2500 MHz | Satellite Phone downlinks |
| 2.4 GHz | WLAN, Bluetooth, spread spectrum, cordless phones |
| 5.2 GHz | New digital cordless phones |
| 3-30 GHz | Radar, data transmission |
| 28-29 GHz | Wireless cable TV? |
| 38.6-40 GHz | High-speed data links |
| 0.3 THz-400 THz | Infrared |
| 400-750 THz | Visible light |
| 750 THz-30 PHz | Ultraviolet light |
| 30-300 EHz |
x-ray |
| 30 EHz-30ZHz |
Gamma radiation |
Cellular Communication Systems
Basically, two different systems exist for cellular phone communication in the US:
- Time Division Multiple Access TDMA
- Code Division Multiple Access CDMS
and the European version of TDMA referred to as GSM.
The Health Effects Debate
The health effects related to high frequency RF exposure are as controversial as that of low frequency EMF or mold exposures. The scientific community is divided. The traditional and current regulatory approach is to acknowledge only the thermal (heating) effect on human tissue and exposure regulations are based on this concept.
However, over the last decade a significant number of studies have shown other potential RF exposure effects such as increased and altered cell proliferation, influences on hormones, heart, circulatory, and nervous system. These are currently not recognized by the regulatory authorities. From an international view point, a number of countries have lowered the permissible public exposure levels significantly. Recommendations by concerned scientists and physicians call for even lower threshold levels. In August, the BioInitiative Report: A Rationale for a Biologically-based Public Exposure Standard for Electromagnetic Fields (ELF and RF) published a comprehensive analysis of existing research and recommends prudent avoidance of excessive EMF’s. You can obtain a copy at www.bioinitiative.org .
Testing Methods
Identification and measurement of high frequency fields is far more intricate then low frequency EMF’s. Testing equipment and measurement results are frequency specific and specific EMF and RF instrumentation to measure specific parameters. At our disposal we have:
Spectrum Analyzers
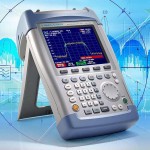 Spectrum analyzers can be used to sweep specific frequency ranges, identify individual sources of that specific frequency and provide information about the strength and the type of the signal. Currently common spectrum analyzers cover frequency ranges between 100 kHz and 3 GHz. Specific antennas are required to ascertain specific frequency ranges Advantages of spectrum analyzers are: that they are selective for a specific amplitude and frequency, capable of making peak value measurements, identifying pulse modulated signals and are very sensitive. The disadvantages are that they are expensive, and complicated to operate.
Broad-spectrum Meters
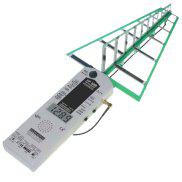 Broad spectrum meters are used to ascertain overall radiation levels. They do not identify the individual sources, frequency or their amplitude but provide a sum of all high frequency sources. They are commonly used for FCC compliance measurements. They usually do not allow for the differentiation between, AM or FM radio, TV communication, cellular frequencies or wireless communication devices. The advantages are that they capture all signals, provide total power level, fast results, are simple to operate and relatively inexpensive. Disadvantages are that they can not differentiate frequencies or capture pulse modulation, and are not very sensitive.
Scanning Devices
 A large number of inexpensive scanning devices have come onto the market. They provide audible sounds or LED light to indicate fields. However, the type or specific strength of radiation can not be determined. In the hands of inexperienced individuals misinterpretations or measurement errors are common occurrences. However, they can be useful to detect the presence of elevated fields.
In conclusion, spectrum analyzers with the appropriate antennas are the most useful instrumentation for high frequency evaluations. We can measure the magnetic or electric portion of the signal.
Data Evaluation
Magnetic field measurements are expressed as power density in nanoWatt per square centimeter (nW/cm2), electric field measurements in volt/per meter (V/m).
Table 3: International regulatory threshold limits, references and guidelines
|
Entity |
Power Density |
|
Regulatory – FCC/ANSI – USA |
579,000 nW/cm2 |
|
Regulatory – Italy, Poland, Hungary, Bulgaria |
10,000 nW/cm2 |
|
Regulatory – Switzerland |
4,500 nW/cm2 |
|
Recommendation – Ecolog Hannover, Germany (2003) |
300 nW/cm2 |
|
Recommendation – Salzburg Resolution, Austria (2000) |
100 nW/cm2 |
|
Recommendation – STOA – EU Parliament (2001) |
10 nW/cm2 |
|
Average range in metropolitan areas |
0.5 – 2 nW/cm2 |
|
Background levels in residential areas |
0.05 -0.5 nW/cm2 |
|
Necessary for cellular phone reception |
0.0001 nW/cm2 |
Table 4: A study conducted in Germany in 2002 of indoor environments in proximity to cellular base stations yielded the following distribution:
|
Percentiles |
Power Density |
Percentiles |
Power Density |
|
10 |
<1 nW/cm2 |
60 |
30 nW/cm2 |
|
20 |
2 nW/cm2 |
70 |
50 nW/cm2 |
|
30 |
4 nW/cm2 |
80 |
100 nW/cm2 |
|
40 |
10 nW/cm2 |
90 |
320 nW/cm2 |
|
50 |
20 nW/cm2 |
95 |
630 nW/cm2 |
Case Studies
Office Building
A cellular base station (small pole with 6 antennas) is located in the parking lot of a two-story medical office building in the Los Angeles area. 12 additional antennas are being installed on the roof of the building. The tenants want to establish a base line prior to the activation on the new roof-mounted antennas. See spectrum analysis Graph2 on page 2. The table below shows the measurement results in representative office.
Table 5: Measurement Results for Power Density in nW/cm2 from different Sources
|
Location |
Cellular Total |
|
Reception – 1st. floor approximately middle of building |
10 nW/cm2 |
|
Physician’s office – 1st. floor in center of building |
3 nW/cm2 |
|
2nd. floor corner offices – closest to antenna pole |
437 nW/cm2 |
|
Medical office – 2nd. floor at interior |
76 nW/cm2 |
|
Office – 2nd. floor at middle of the building |
34 nW/cm2 |
|
2nd. floor corner office – furthest away from antenna pole |
235 nW/cm2 |
It is expected that the levels on the second floor offices will increase with the activation of the roof-based cellular base station.
Residential Building
A single story home located halfway down Mount Soledad in San Diego. A new cellular base station was established on the roof of a recreation center across the street. Measurements were performed prior to activation to establish a baseline. A significant number of transmission antennas for radio, TV, cellular, public and military communication are located on top of Mt. Soledad.
Table 6: Measurement Results for Power Density in nW/cm2 from different Sources
|
Location |
FM Radio and TV |
Cellular Phone |
Paging |
PCS Phone |
Portable Wireless Phone |
Total |
| Family room |
53 |
0.1 |
1 |
0.1 |
439 |
493.2 |
|
Master bedroom |
21 |
0.1 |
2 |
0.1 |
0.1 |
23.3 |
|
Front yard |
47 |
0.1 |
0.1 |
0.1 |
0.1 |
47.4 |
The strongest signals outside signals (highest amplitude) were associated with FM radio and TV transmission towers. However, the highest radiation source was 2.4 GHz from the wireless phone base station in the family room, which was used as an office. See spectrum analysis Graph 1 on page 1.
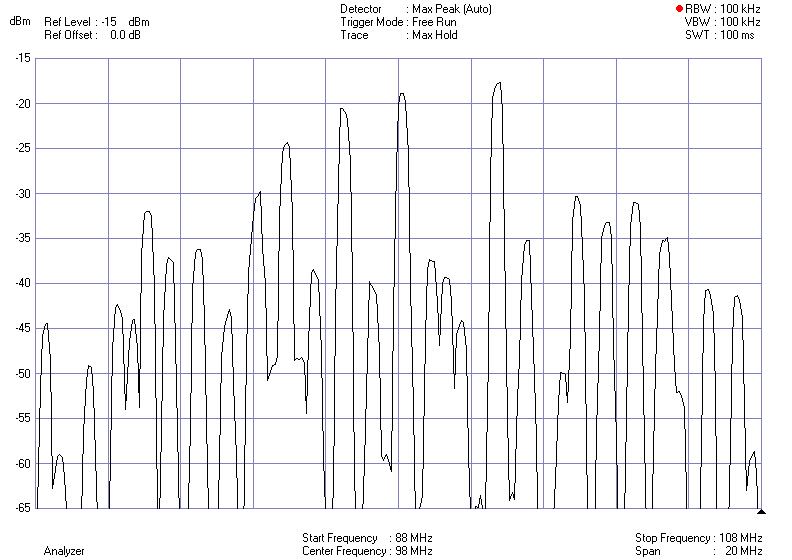
Graph 3; Spectrum analysis of FM radio stations
Summary
We are constantly increasing our high frequency exposure load by the increased usage of wireless communication networks such as cell phones, baby monitors, WLAN (wireless local area networks), Bluetooth and other applications. Careless in-house wireless network installations can become a significant source of microwave radiation in a home or building. Care should be taken on how and where we install and use wireless networks within our indoor environments, especially in bedrooms, and areas where we spent a significant amount of time.
 |
 |
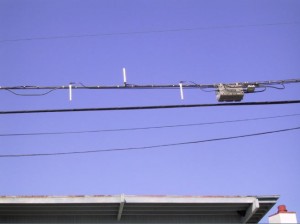 |
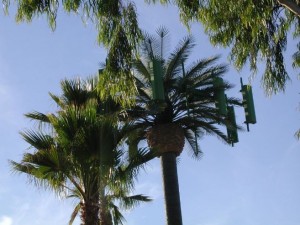
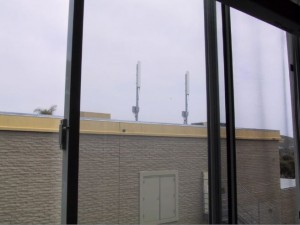
Cellular base stations (“Hot Spots”) are being established inside commercial buildings, on street lamp posts and on towers across from residential buildings. In situations where outside sources such cellular base stations are a significant and unavoidable source, selection of certain construction materials can reduce exposures significantly.
In existing building the options are more limited. However, a number of RF shielding materials are available. For example, the application of metal-based UV shielding films on the windows will usually reduce the levels from outside emission sources by 30 to 35 decibel (dB).
If rf radiation shielding of indoor environments is taken into consideration, it should always be conducted in conjunction with spectrum analysis measurements to identify the significant source frequencies and amplitude, to choose the most effective materials for that frequency and to verify successful mitigation.
The determining factors for the exposure from high frequency source are:
-
Distance to the antenna site
-
Line of sight to the antenna site
- Type of antennas, e.g. omni directional or directional antennas
-
Number, power, and orientation of the antennas
-
Capacity of the antenna site (no of channels / frequencies)
-
Height difference between location and antenna site
-
Type of building construction / type of window glass
-
Total reflection of the environment
The precautionary principles also needs to apply to high frequency radiation. In a press release issued on August 1, 2007, the Germany Department for Radiation Protection discourages the use of wireless local area networks (WLAN), i.e. wireless internet routers in homes and businesses. It warns that inappropriately placed wireless internet routers can create high levels of microwave radiation. It recommends the use of hard-wired internet assess systems instead.
Report Prepared by:
Peter H. Sierck, Principal/Industrial Hygienist
1106 2nd Street #102, Encinitas, CA 92024
Tel: (760) 942-9400 ▲ www.EMFRF.com
If you’re still asking yourself the question What is RF and you are concerned about potential dangers from electromagnetic field exposure for your home, your school, your commercial office building, or you are about to get involved with a residential or commercial real estate transaction, EMF & RF Solutions can help. We are experts at EMF testing, shielding, mitigation and low EMF building design.
